
Imagine you are holding a bag of rare collectible coins. You want to sell them quickly, but when you ask around, no one is buying at the price you expect. Or worse, the only buyer offers half the value because they know you need cash now. This is the essence of illiquidity. In the fast-paced world of Cryptocurrency digital assets that operate on blockchain networks without central authority, this scenario happens constantly. Understanding how to measure liquidity isn't just academic jargon; it is the difference between executing a profitable trade and getting stuck with an asset you cannot sell.
Liquidity refers to how easily you can buy or sell an asset without moving its price significantly. High liquidity means you can enter or exit positions instantly at fair prices. Low liquidity means high risk, wide gaps between buy and sell orders, and potential losses from slippage. Since crypto markets run 24/7 globally, liquidity fluctuates based on time zones, news events, and market sentiment. Knowing how to measure it gives you a strategic edge over traders who simply look at price charts.
Key Takeaways
- Bid-Ask Spread is the quickest indicator of immediate liquidity; narrower spreads mean lower transaction costs.
- Order Book Depth reveals whether the market can absorb large trades without causing drastic price changes.
- Trading Volume alone is misleading; always compare volume against market cap and check for wash trading.
- Slippage measures the actual cost of execution, showing the gap between expected and real fill prices.
- DEX vs. CEX: Decentralized exchanges use liquidity pools and AMMs, requiring different metrics like Total Value Locked (TVL) compared to traditional order books.
The Core Metrics: What to Look At First
To gauge liquidity accurately, you need to look beyond the current price tag. Start with the three pillars of liquidity measurement: spread, depth, and volume. These metrics work together to paint a complete picture of market health.
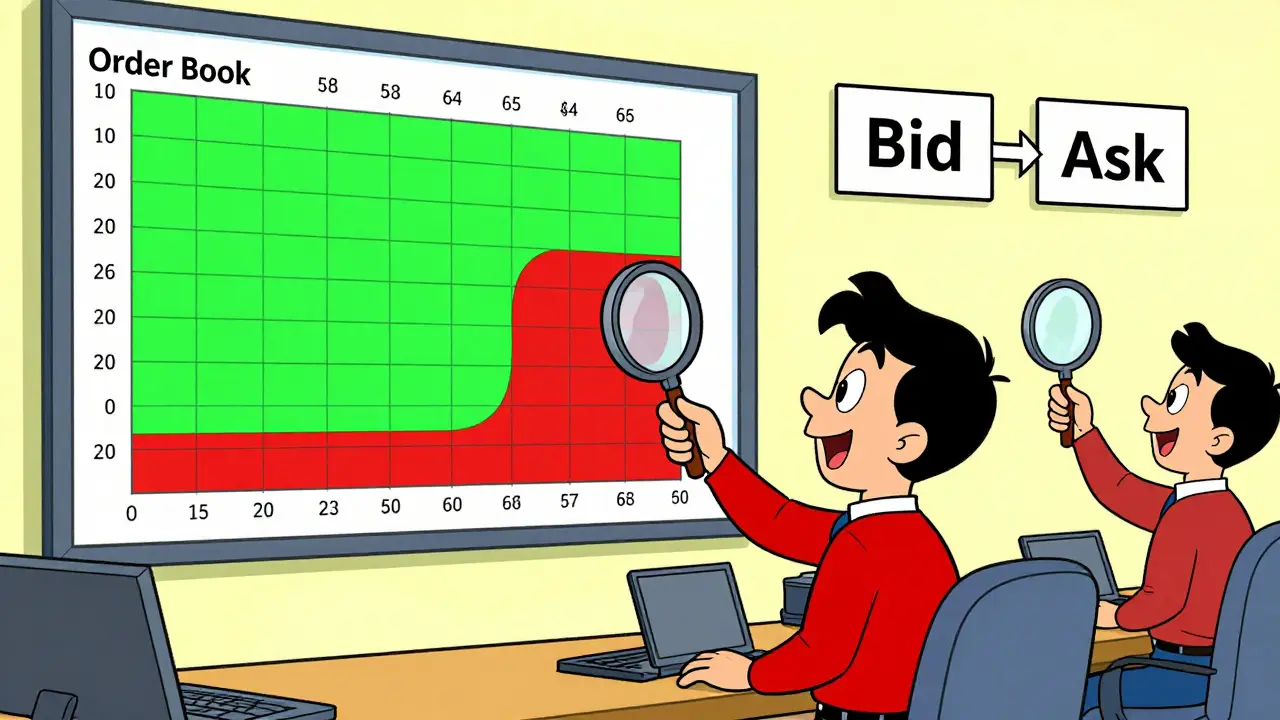
Bid-Ask Spread: The Cost of Instant Access
The bid-ask spread is the most direct measure of short-term liquidity. It represents the difference between the highest price a buyer is willing to pay (bid) and the lowest price a seller is asking (ask). On centralized exchanges like Binance one of the largest cryptocurrency exchanges by trading volume or Coinbase, you can see this data in real-time.
If Bitcoin is trading at $60,000, the bid might be $59,998 and the ask $60,002. The spread is $4. For a major asset, this is tiny. But for a small-cap altcoin, the bid might be $1.00 and the ask $1.10. That 10% spread means you lose 10% of your value the moment you buy if you want to sell immediately. Narrow spreads indicate high competition among market makers, which equals high liquidity. Wide spreads suggest few participants and higher risk.
Order Book Depth: Can the Market Handle Your Size?
Spread tells you about small trades. Order book depth tells you about large ones. Depth refers to the quantity of buy and sell orders sitting at various price levels away from the current market price. Imagine trying to sell 100 BTC. If there are only 10 BTC available at the current price, your order will eat through those and continue down the book, lowering the average price you receive. This is called price impact.
A deep order book has thick layers of orders far from the current price. This allows institutional investors to move millions of dollars without crashing the market. Shallow books mean even moderate-sized trades can cause volatility spikes. Always check the top 5-10 levels of the order book before placing significant orders.
Trading Volume: The Activity Gauge
Volume measures the total amount of an asset traded over a specific period, usually 24 hours. High volume generally suggests high liquidity because it indicates active participation. However, volume can be deceptive. Some exchanges inflate numbers through wash trading (buying and selling to oneself) to appear more popular than they are.
To verify true volume, cross-reference data across multiple reputable platforms. Tools like CoinMarketCap or CoinGecko aggregate data from dozens of exchanges. If a token shows massive volume on one obscure exchange but zero elsewhere, treat that volume with skepticism. Real liquidity requires genuine buyer-seller interaction across diverse venues.
Advanced Indicators: Slippage and Illiquidity Ratios
For serious traders and analysts, basic metrics aren't enough. You need to understand the hidden costs and mathematical models that define true market efficiency.
Slippage: The Real Cost of Execution
Slippage is the difference between the expected price of a trade and the price at which the trade is actually executed. It occurs due to low liquidity, high volatility, or large order sizes. If you place a limit order at $100, but market conditions shift slightly during execution, you might get filled at $99.50. That $0.50 is slippage.
In highly liquid markets like Ethereum or Bitcoin, slippage is often negligible for retail-sized trades. In illiquid markets, slippage can devour profits. Advanced platforms calculate estimated slippage before you confirm a trade. Always set a maximum slippage tolerance in your settings to prevent unexpected losses during volatile moments.
The Amihud Illiquidity Ratio
Academic research, including studies referencing the Amihud ratio established in 2002, provides a more nuanced view. This metric calculates the relationship between price impact and trading volume. Essentially, it asks: "How much does the price move per unit of volume traded?" A high Amihud ratio indicates that even small trades cause significant price swings, signaling poor liquidity. This is particularly useful for comparing liquidity across different assets or time periods where raw volume numbers might be misleading.
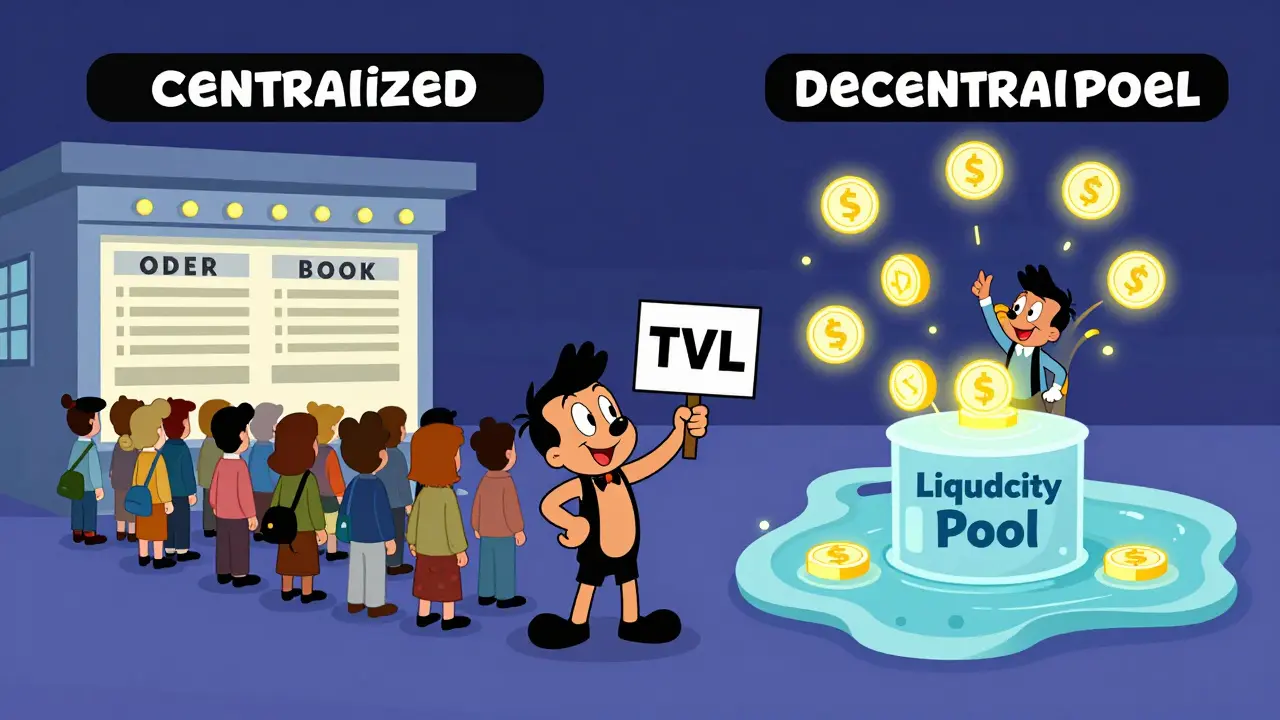
Centralized vs. Decentralized Exchanges: Different Rules Apply
Liquidity works differently depending on where you trade. Centralized Exchanges (CEXs) and Decentralized Exchanges (DEXs) operate on fundamentally distinct architectures, requiring different measurement approaches.
| Feature | Centralized Exchange (CEX) | Decentralized Exchange (DEX) |
|---|---|---|
| Mechanism | Order Book (Bid/Ask) | Automated Market Maker (AMM) / Liquidity Pools |
| Primary Metric | Order Book Depth & Spread | Total Value Locked (TVL) & Pool Size |
| Price Determination | Supply/Demand Matching | Constant Product Formula (e.g., x*y=k) |
| Slippage Source | Thin Order Books | Small Pool Sizes relative to Trade Amount |
| Data Source | Exchange API / Order Book UI | Blockchain Explorers / DeFi Dashboards |
On a CEX like Kraken, you analyze the order book directly. On a DEX like Uniswap or PancakeSwap, there is no order book. Instead, liquidity providers deposit pairs of tokens into smart contract pools. Here, you measure liquidity by looking at the Total Value Locked (TVL) in a specific pool. A larger pool means less slippage for traders. You also need to monitor the ratio of tokens in the pool; imbalances can lead to impermanent loss for providers and higher costs for traders.
Tools for Measuring Liquidity in Real-Time
You don't need to be a mathematician to track these metrics. Several tools automate the process, providing visual dashboards and alerts.
- Aggregators: Platforms like CoinGecko and CoinMarketCap offer quick snapshots of volume and market cap. Use them for initial screening.
- Blockchain Explorers: Etherscan, BSCScan, and Solscan allow you to verify on-chain transactions. Check for large wallet movements or unusual activity that might signal liquidity drains.
- DeFi Analytics: Tools like DeBank, Zapper, and Glassnode provide deeper insights into liquidity pool compositions, historical volume trends, and holder concentration. They help identify if liquidity is fragmented across many small pools or concentrated in a few dominant ones.
- Exchange Interfaces: Most major CEXs have built-in depth charts and heatmaps. Learn to read these visuals; they show where large buy/sell walls are located, helping you anticipate support and resistance levels.
Common Pitfalls and How to Avoid Them
Even experienced traders make mistakes when assessing liquidity. Here are the most common traps:
- Ignoring Time Zones: Crypto markets are global, but human activity is not. Liquidity often dips during Asian night hours or weekends when institutional participation slows. Large trades executed during off-peak times face higher slippage.
- Trusting Single Exchange Data: As mentioned, wash trading inflates volume. Always compare data across at least three major exchanges to validate liquidity claims.
- Confusing Market Cap with Liquidity: A token can have a billion-dollar market cap but very low daily volume. This means the price is theoretical, not tradable. Liquidity Finder research highlights that assets like BNB may have high volume but poor depth/spread metrics in certain contexts, proving market cap is not a perfect proxy.
- Overlooking Stablecoin Pegs: For stablecoins like USDT or USDC, liquidity is tied to their ability to maintain a $1 peg. During crises, liquidity can evaporate as users rush to redeem, causing temporary de-pegging. Monitor the reserves backing these assets.
Why Liquidity Matters for Your Strategy
Understanding liquidity transforms how you approach trading. If you are a day trader, you need tight spreads and high depth to enter and exit quickly. If you are a long-term investor, you care about consistent volume and broad market participation to ensure you can sell years later. Institutional investors, such as those behind recent Bitcoin and Ethereum ETFs, rely heavily on deep futures markets and standardized contracts to manage risk. Their entry into the space has improved overall market structure, creating more transparent environments for all participants.
By mastering these measurements, you stop guessing and start calculating. You protect your capital from hidden costs and position yourself to capitalize on market inefficiencies. Liquidity is the lifeblood of any market; knowing how to measure it keeps you alive in the game.
What is the best single metric to measure cryptocurrency liquidity?
There is no single "best" metric, but the bid-ask spread is the most immediate indicator for short-term trading. For a comprehensive view, combine bid-ask spread with order book depth and 24-hour trading volume. Academic studies suggest the Abdi and Ranaldo estimator performs well across different frequencies, but for practical purposes, checking spread and depth on major exchanges is sufficient for most traders.
How do I check liquidity on a decentralized exchange (DEX)?
On a DEX, look at the Total Value Locked (TVL) in the specific trading pair's liquidity pool. Higher TVL generally means better liquidity and lower slippage. Use tools like DeBank or the DEX interface itself to view pool size. Also, check the ratio of the two tokens in the pool; balanced pools offer better pricing stability.
Is high trading volume always a sign of good liquidity?
Not necessarily. High volume can result from wash trading, where bots buy and sell to themselves to create fake activity. To verify, check if volume is consistent across multiple reputable exchanges. Also, compare volume to market cap; extremely high volume relative to market cap can indicate manipulation rather than organic interest.
What causes slippage in crypto trades?
Slippage occurs when there is insufficient liquidity at the desired price level. Your order consumes available orders at the best price and moves to worse prices until fully filled. This is common in low-volume tokens, during high volatility, or when executing large orders that exceed the immediate depth of the order book or liquidity pool.
Does liquidity change throughout the day?
Yes, liquidity fluctuates based on global market activity. Peak liquidity often occurs during overlapping trading hours of major financial centers, such as when U.S. and European markets are both open. Liquidity tends to decrease during weekends and late-night hours in Asia, making large trades more expensive due to wider spreads and thinner order books.